We think transparency is of utmost importance when delivering product recommendations to an audience, and for a number of key reasons. Not only do transparent testing methodologies help other outlets to review their own practices (and visa versa), but it also allows our audience and readers to see exactly how we reached certain results data. Furthermore, providing transparent testing methodologies allows our readers to replicate our tests with their own hardware, perfect if we haven’t quite got the comparative data point you are looking for!
That’s why we’ll be detailing in this piece exactly how we test graphics cards (GPUs) in the articles on this site, be it in a review, buyer’s guide or across our YouTube channel.
Our website and YouTube channel share the same testing team, with Harry Coleman leading up our GPU testing efforts, with Jay Harris providing cover and support as and when is required. This allows us to ensure our data points and results marry up across all of the platforms to which we post content, and means you can switch between our video and written content seamlessly.


Our Testing Rig
To test our wide suite of graphics cards, we use a unified testing setup whereby the hardware stays constant across our tests. This is our control variable. We may, from time to time, test using alternative hardware (e.g. if we are trying to show the performance of a budget GPU alongside other budget hardware), but will always make it explicitly clear where this is the case.
We update our testing rig regularly, primarily to ensure no CPU or memory bottlenecks, and a change in our testing rig will always lead to us running new data for all data points in our tests. In basic terms, this means that every time our test rig sees a hardware change, we retest each and every graphics card to garner fresh results.
| Component | Name | Why We Selected this Part |
|---|---|---|
| CPU | Intel Core i9 13900K | The i9-13900K remains one of the fastest CPUs around, and strong single and multi-threaded performance ensures we avoid a CPU bottleneck. |
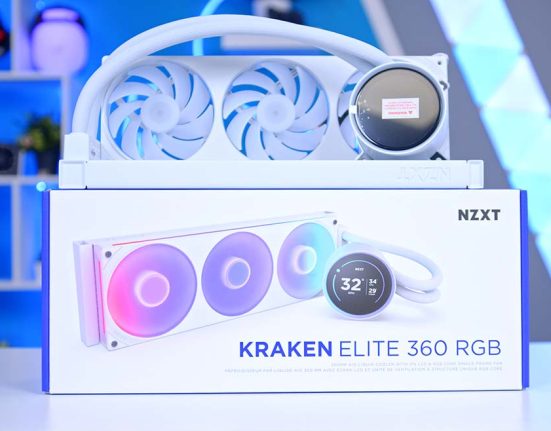
| CPU Cooler | Deepcool LS720 360mm AIO | This 360mm cooler from Deepcool ensures the 13900K can reach maximum boost clock speeds. We do not overclock our parts for testing fast factory speeds. |
| Motherboard | MSI MEG Z790 ACE | Compatibility with the i9-13900K, and widespread PCI-E Gen 5.0 support ensures this high-end board is good now and into the future. |
| RAM | G.Skill Trident Z NEO 32GB 6000MT/s CL32 | 32GB is currently enough for gaming in our testing, while a low latency and 6000MT/s speed is on the better end of DDR5 options. |
| SSD | Seagate Firecuda 530 2TB | With enough room for all of our test games, and fast Gen4 speeds, the Firecuda 530 is a great test drive. |
| Case | Open Frame Test Case | We use a custom, open-frame test chassis to test our cards. The main reason for this is that it allows us to easily swap out the GPU in mass benchmarking sessions! (Oh, and it doesn’t constrain airflow) |
| PSU | Thermaltake Toughpower 1350W | This modern ATX 3.0 power supply allows us to test the latest graphics cards using either 6+2pin or 12pin connectors natively, without the use of adapters. The high wattage ensures we can use this across all models of graphics cards. |
How Often We Update Our Results
We don’t set strict or arbitrary time frames on when our data should be retested, because such dates are just that: arbitrary. Instead we consider the following factors when planning our data testing time frames:
- Driver releases: These bring optimisations which can increase performance.
- Game updates: These can also bring optimisations to performance and certain hardware.
- Recency: When some of our results are getting long in the tooth, we will proactively retest data. We will also do this when other factors cause comparative data to be updated to ensure fair reference points.
- Viewer Feedback: While very uncommon, if our audience flag any of our data, we will look to retest and check the data is correct. In this instance, our findings may not change and the data will stay the same.
- Major hardware releases: With any new hardware release, we will look to ensure comparative data is both relevant and up to date.
Which Game Titles We Test
We categorise our titles based on category. We will always try and ensure a good mix of games from a variety of genres. These are categorised below. We do take requests for games to add to our testing line-up, but understandably cannot test every popular title around.
- RPG Games: Hogwarts Legacy, Baldur’s Gate 3, Cyberpunk 2077, Starfield, Red Dead Redemption 2, Witcher 3: Wild Hunt, Far Cry 6
- FPS Games: COD Warzone 2, MW2 (2022), Apex Legends, Fortnite, Overwatch 2
- Simulation Games: F1 2023, Forza Horizon 5, Microsoft Flight Simulator


Which Settings We Use in Our GPU Testing
| Game | Resolution | Settings |
|---|---|---|
| Hogwarts Legacy | 1080p 1440p 4K | Effects: High Material: High Fog: High Sky: High Foliage: High Post Process: High Shadows: High Textures: High View Distance: High Population: High DLSS/FSR & RT Optionally Used |
| Baldur’s Gate 3 | 1080p 1440p 4K | Model Quality: High Shadow Quality: Medium Cloud Quality: Medium Texture Quality: High Texture Filtering 8X Instance Distance: High Fog Quality: High Detail Distance: High Animation LoD: High Anti-Aliasing: SMAA Sharpening: Off DLSS/FSR Optionally Used |
| Cyberpunk 2077 | 1080p 1440p 4K | Texture Quality: High FOV: 100 Chromatic Aberration: On Lens Flare: On Motion Blur: Off Contact Shadows: On Improved Facial Geometry: On Anisotropy: 8x All Texture Settings: High DLSS/FSR & Raytracing Optionally Used |
| Starfield | 1080p 1440p 4K | Texture Quality: High Field of View (FOV): 100 Chromatic Aberration: On Lens Flare: On Motion Blur: Off Contact Shadows: On Improved Facial Geometry: On Anisotropy: 8x All Texture Settings: High DLSS/FSR & Raytracing Optionally Used |
| Red Dead Redemption 2 | 1080p 1440p 4K | Quality Preset Level: Custom Tripler Buffering: Off Texture Quality: High Anisotopic Filtering: 8x Lighting Quality: High Shadow Quality: High Water Quality High TAA: High Motion Blur: Off DLSS/FSR & Raytracing Optionally Used |
| Witcher 3: Wild Hunt | 1080p 1440p 4K | Anti-aliasing: FS2 2 FSR Quality: Quality Dynamic Resolution Scaling: Off Screen Space Ambient Occlusion: SSAO Motion Blur: Off Depth of Field: On Chromatic Aberration: On Shadow Quality: High Terrain Quality: High DLSS/FSR & Raytracing Optionally Used |
| Far Cry 6 | 1080p 1440p 4K | Graphics Quality: High Texture Filtering: High Shadows: High Environment: High Water: High Terrain: High Anti-aliasing: TAA Motion Blur: Off Camera Shakes: Full DLSS/FSR & Raytracing Optionally Used |
| COD Warzone 2 | 1080p 1440p 4K | Resolution: 1080p High Upscaling/Sharpening FSR 2.1 Quality Texture Resolution: Normal Texture Filter Anisotropic: High Level of Detail: High |
| COD MW2 (2022) | 1080p 1440p 4K | Resolution: 1080p High Upscaling/Sharpening FSR 2.1 Quality Texture Resolution: Normal Texture Filter Anisotropic: High Level of Detail: High |
| Apex Legends | 1080p 1440p 4K | Field of View (FOV): 110 Anti-aliasing: TSAA Texture Filtering: 8X Model Detail: High VSync: Disabled Effects: High Ambient Occlusion Quality: High |
| Fortnite | 1080p 1440p 4K | Anti-aliasing & Super Resolution: TSR High Temporal Super Resolution: Performance View Distance: Far Textures: Low |
| Overwatch | 1080p 1440p 4K | Graphics Quality: Ultra High Quality Upsampling FSR: 1.0 Texture Quality: High Antialias Quality: High – SMAA Medium Ambient Occlusion: Medium |
| F1 2023 | 1080p 1440p 4K | Graphics Quality: High Anisotropic Filtering: 8x Ray Tracing: Off Textures: Ultra High Ambient Occlusion: HBAO+ |
| Spiderman Miles Morales | 1080p 1440p 4K | Texture Filtering: 4x Anisotropic FSR 2.1 Quality VSync: Off Ray Tracing: Off |
Tools We Use to Test GPUs
We use a number of different tools in our graphics card testing. These include monitoring tools, stress test tools and synthetic benchmarks.
- MSI Afterburner: This allows us to adjust GPU fan speed, clock speeds and temperatures.
- Rivatuner: This gives us an onscreen overlay of frame rates, temperatures and 1% lows.
- NVIDIA Frameview: This tool records data about the average, 90th and 99th percentile frame rates.
- Furmark: This tool stress tests the GPU for temperature and noise testing.
- 3D Mark: This synthetic benchmark gives us repeatable numbers for overall performance.
Why You Can Trust Us
Our writers and benchmarking team work independently to recommend only the best products out there. None of our team are financially incentivised to recommend once product over another, and all of our content is written by real people who are all experts in their field. In fact, our testing all happens in person with the team, allowing for realtime peer review and checking. We run our tests multiple times to ensure our results are fair and accurate. You can read in more detail about our editorial policy, but know that recommending only the best products has always been, and will always be, at the heart of what we do and why we exist.


![FI_[DM89] Phanteks Evolv + AORUS 5090 9850X3D Gallery (8)](https://geekawhat.com/wp-content/uploads/2026/02/FI_DM89-Phanteks-Evolv-AORUS-5090-9850X3D-Gallery-8-551x431.jpg)
